M4 Calls Dashboard
Description
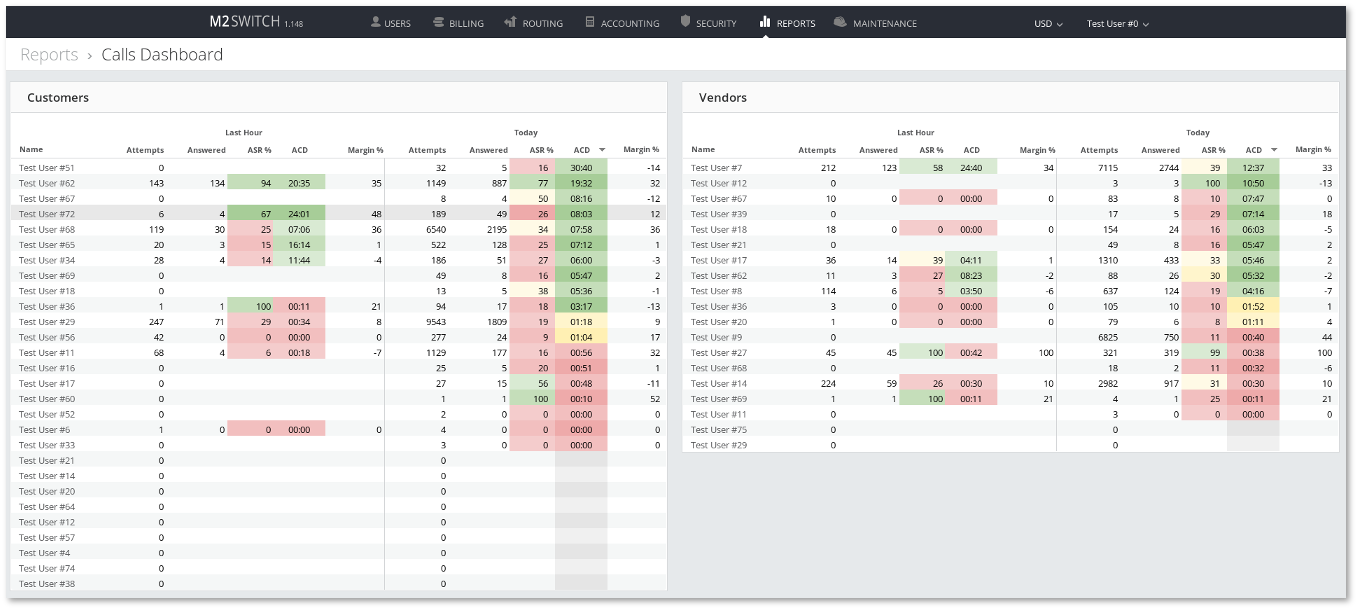
The M4 Calls Dashboard provides live statistics about the Calls happening in the System in real-time.
The report is structured in two side-by-side tables: Customers on the left and Vendors on the right. Each of the two tables includes statistics for the Last Hour (from now till one hour ago) and for Today (from the beginning of the day in the viewer's Time Zone till now). For these periods aggregations such as Call Attempts, Answered Calls, ASR, ACD, and Margin are provided.

Custom cell coloring can be applied in order to visually alert about for instance the abnormalities happening with the Calls for some Customers or Vendors.
Note: Only the Calls which Hangup Cause Code IS NOT in the interval [300;312)∪(312;399] are counted as Call attempts. This is because Hangup Causes like 320 - Balance too low to make a call affect statistics such as ASR in a wrong way and DO NOT reflect the quality of the Calls.
Usage
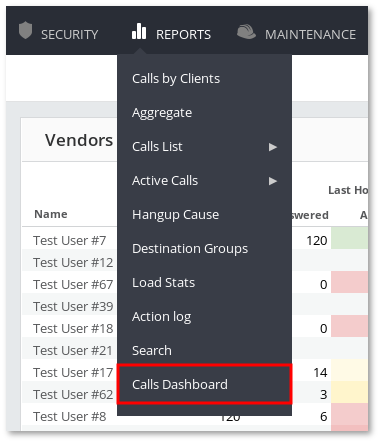
Calls Dashboard can be used by the System Admin and Managers (with the permission: REPORTS > Calls Dashboard).

Setup
In the System Settings, several adjustments can be made in order to customize the Calls Dashboard.

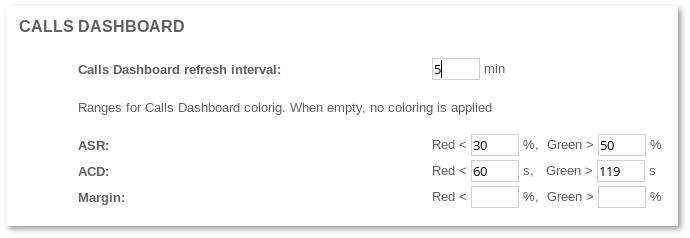
Calls Dashboard refresh interval: how often the statistics are updated (a positive integer representing minutes).
ASR: as in the example, when lower than 30%, the cells will be colored red, and greater than 50% value will result in a green color. Everything between will be set to yellow (only integers are allowed).
ACD: as in the example, when lower than 60 seconds, the cells will be colored red, and greater than 119 seconds value will result in a green color. Everything between will be set to yellow (only integers are allowed).
Margin: as in the example, no coloring will be applied on Margin cells.
Note: partial coloring is also possible. For example, when the ASR is set to Red < 30 and Green > is left blank, only red coloring will be present for the ASR cells.
