Server is overloaded
Description
MOR constanty monitors it's servers for various performance stats:
- Hard disk IO
- CPU
MOR according to the complexity of the task may sometimes not allow you to do some tasks during high workloads with this message for admin:
System is working on some queries already. Please try later.
and this message for other users:
Functionality temporary suspended. Please try again in 5 minutes.
This means that your server(-s) are busy and you should retry the tasks later.
Protection against high loads is implemented in all statistics pages.
Configuration
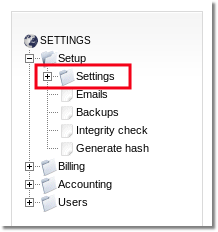
Go to SETTINGS –> Setup –> Settings

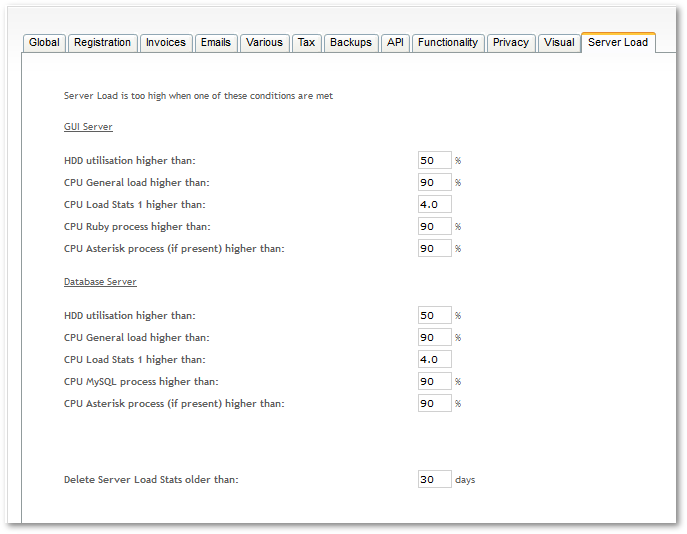
Click on Server load tab and you will see settings:

Here you can set parameters which define when Server is overloaded. Those Settings will be applied to GUI and Database Servers.
You can check your server load statistics here: http://IP/billing/stats/server_load/1 (where IP is your GUI IP) and adjust your system's Server load accordingly.
That is, check what is the average load of your system and set the Server load settings a little bit higher (e.g. if the average HDD load is around 40%, set HDD utilisation higher than: 45% ).
This way you will be notified if something goes wrong and server loads are higher than the average.
Set 0 if you want to disable checking.
Recommended parameters
These are the recommended parameter for Server load. They might be slightly different depending on the system:
GUI
HDD Utilization: 90%
CPU General Load: 0
CPU Load Stats: Core number
CPU Ruby: 0
CPU Asterisk: 0
DB server:
HDD Utilization: 90%
CPU General Load: 0
CPU Load Stats: Core number
CPU MySQL: 0
CPU Asterisk: 0
You can check what is your system's core number by opening the terminal and typing:
top
Then type in "1" and you will see the core list from zero to n. For example if CPU3 is the last in your list, this means that your server has 4 cores (do not forget to include CPU0).
"Delete Server Load Stats older than" option
"Delete Server Load Stats older than" option means that server load stats older that marked in field are removed from Database in order to safe server capacity. 30 days is a default value. Usually, when troubleshooting of server is needed, Load stats from last 30 days are enough in order to find related problems.
MY SERVER IS BLOCKED! NOTHING WORKS! THE SERVER IS OVERLOADED!
- Everything is OK, MOR just protected your server from crashing from high GUI/DB usage and saved your business
- Adjust Server Load settings and check load statistics as shown above
- If it does not help - this means your server is too weak to service your GUI requests, consider moving GUI to a separate server
