Difference between revisions of "Providers Statistics"
| (6 intermediate revisions by 4 users not shown) | |||
| Line 1: | Line 1: | ||
=Description= | |||
Calls statistics by Providers lets you to see report of calls for concrete Provider. | |||
<br><br> | |||
=Usage= | |||
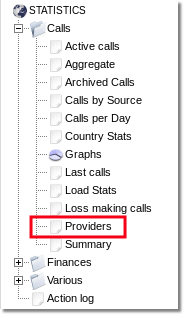
Go to '''STATISTICS –> Calls –> Providers'''. | |||
<br><br> | |||
[[File:providers_stats_path.png]] | |||
<br><br> | |||
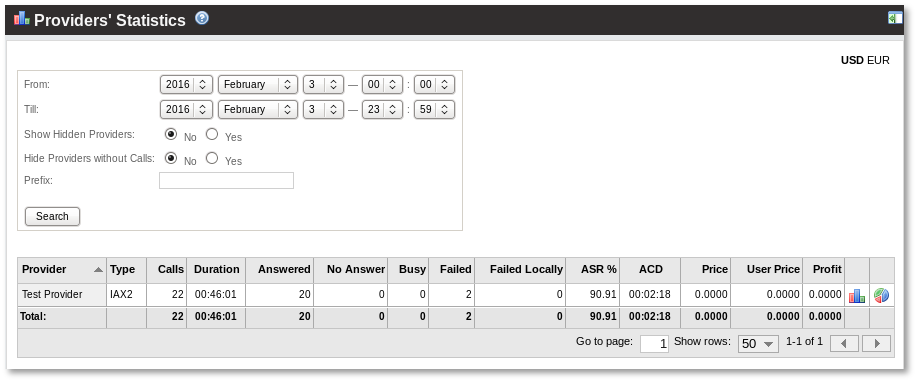
This report shows all providers' statistics at once: | |||
<br><br> | |||
[[Image:provider-stats.png]] | |||
<br><br> | |||
In the selected period, you can check various statistics about all the providers in your system. If you click on a number in the Answered/No Answer/Busy/Failed columns, you will open a window where these calls are listed. | In the selected period, you can check various statistics about all the providers in your system. If you click on a number in the Answered/No Answer/Busy/Failed columns, you will open a window where these calls are listed. | ||
While making a prefix search, if you want to see all prefixes starting with a certain combination, you should enter ''%'' at the end. For example, if you want to see all prefixes starting with 37 you will have to enter 37%. If you enter only 37 you will only see this prefix. | |||
<br><br> | |||
=Detailed Provider Statistics= | |||
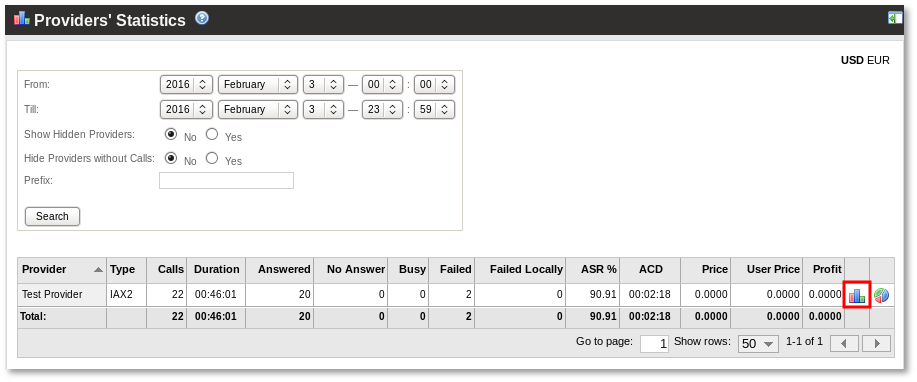
To see detailed Statistics of a selected Provider, just click on the '''bar chart icon''' in the main table: | |||
<br><br> | |||
[[Image:Provider_Statistics_indicate_detailed.png]] | |||
<br><br> | |||
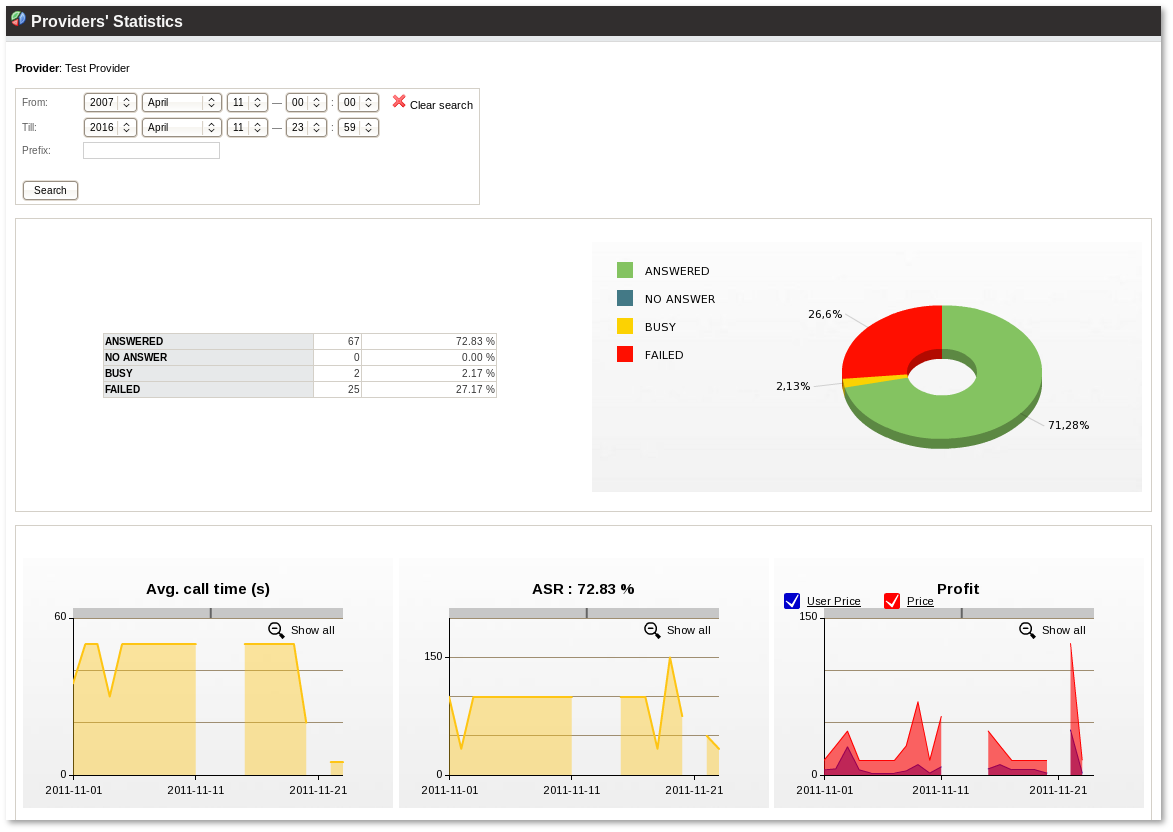
You will then be redirected to a page with detailed graphs where it is possible to investigate various properties of calls made through the selected Provider: | |||
<br><br> | |||
[[Image:Provider_Statistics_detailed.png]] | |||
=See also= | |||
* [[Aggregate]] | |||
* [[Summary]] | |||
* [[Providers]] | |||
Latest revision as of 14:56, 11 April 2016
Description
Calls statistics by Providers lets you to see report of calls for concrete Provider.
Usage
Go to STATISTICS –> Calls –> Providers.

This report shows all providers' statistics at once:

In the selected period, you can check various statistics about all the providers in your system. If you click on a number in the Answered/No Answer/Busy/Failed columns, you will open a window where these calls are listed.
While making a prefix search, if you want to see all prefixes starting with a certain combination, you should enter % at the end. For example, if you want to see all prefixes starting with 37 you will have to enter 37%. If you enter only 37 you will only see this prefix.
Detailed Provider Statistics
To see detailed Statistics of a selected Provider, just click on the bar chart icon in the main table:

You will then be redirected to a page with detailed graphs where it is possible to investigate various properties of calls made through the selected Provider:

