Difference between revisions of "Dashboard"
(Created page with '=Description= Dashboard Addon allows to view your softswitch data in nice and presentable way. <br><br> == Functionality == Dashboard Addon is based on [https://grafana.com/ Gr…') |
|||
| (One intermediate revision by one other user not shown) | |||
| Line 1: | Line 1: | ||
<div align="center"><BIG><BIG><BIG><BIG>[[Image:warning.png|30px]]'''IMPORTANT - this product is no longer supported!'''</BIG></BIG></BIG></BIG></div> | |||
=Description= | =Description= | ||
Dashboard | Dashboard allows to view your softswitch data in nice and presentable way. | ||
<br><br> | <br><br> | ||
== Functionality == | == Functionality == | ||
Dashboard | Dashboard is based on [https://grafana.com/ Grafana] which allows many many various data presentation formats. | ||
<br><br> | <br><br> | ||
Dashboard | Dashboard is in the beginning of the development so only basic Active Calls and Web Monitoring functionality is present. | ||
<br><br> | <br><br> | ||
We will expand it and add new functionality based on our Client’s feedback. | We will expand it and add new functionality based on our Client’s feedback. | ||
| Line 17: | Line 20: | ||
<br><br> | <br><br> | ||
=== Web Monitoring === | === Web Monitoring === | ||
Dashboard | Dashboard can monitor your web page availability sending requests from around the world. | ||
<br><br> | <br><br> | ||
[[Image:Dashboard2.png]] | [[Image:Dashboard2.png]] | ||
Latest revision as of 07:26, 10 February 2021
Description
Dashboard allows to view your softswitch data in nice and presentable way.
Functionality
Dashboard is based on Grafana which allows many many various data presentation formats.
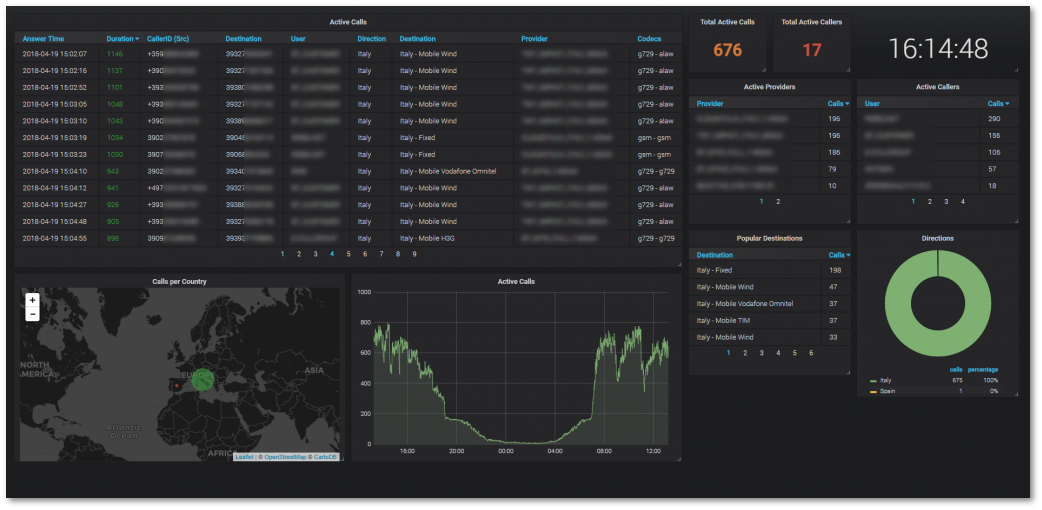
Dashboard is in the beginning of the development so only basic Active Calls and Web Monitoring functionality is present.
We will expand it and add new functionality based on our Client’s feedback.
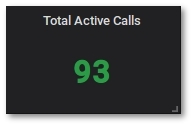
Active Calls
It is possible to add any data from Kolmisoft Softswitch in any format. Tell us what you need – and we will do it!
Web Monitoring
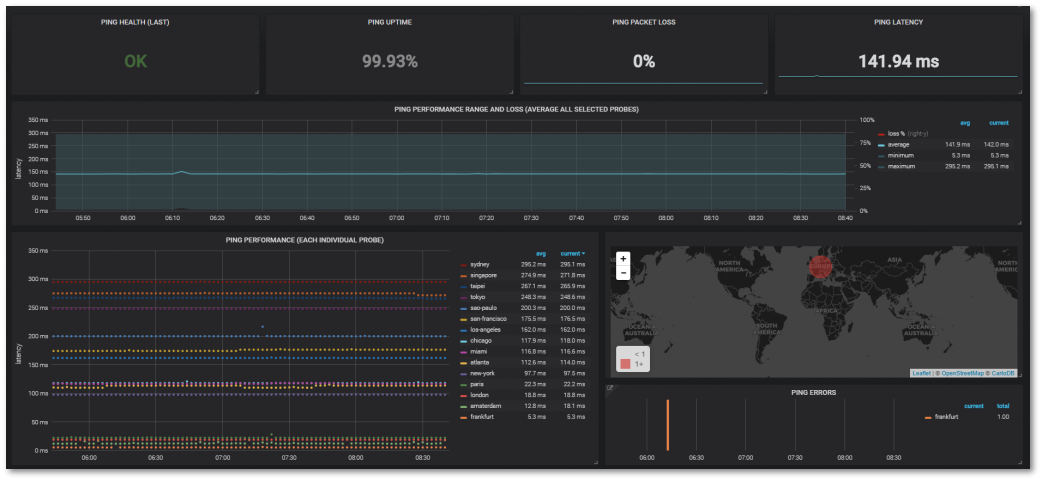
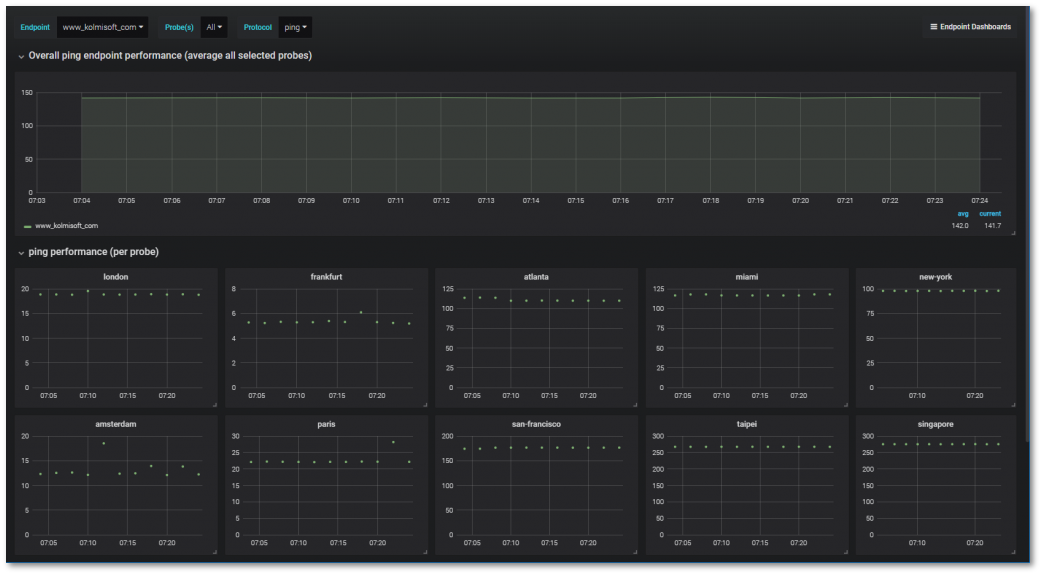
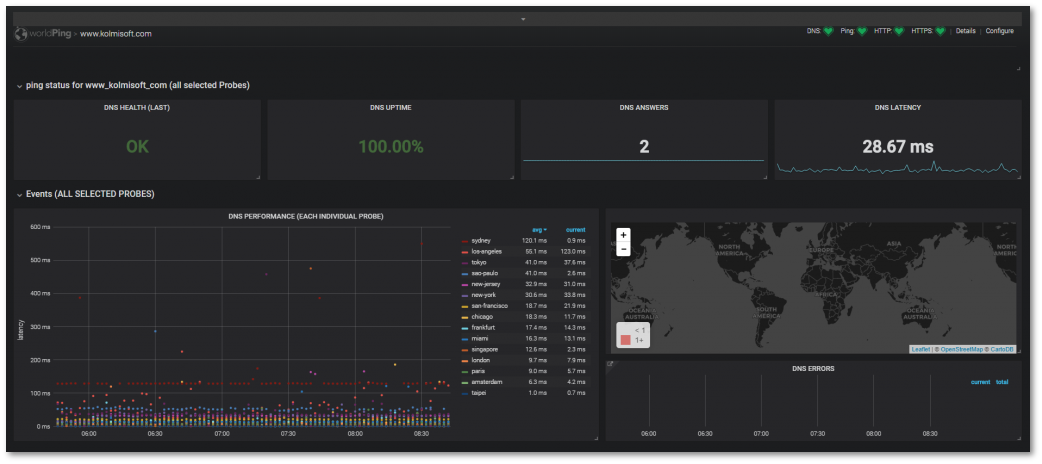
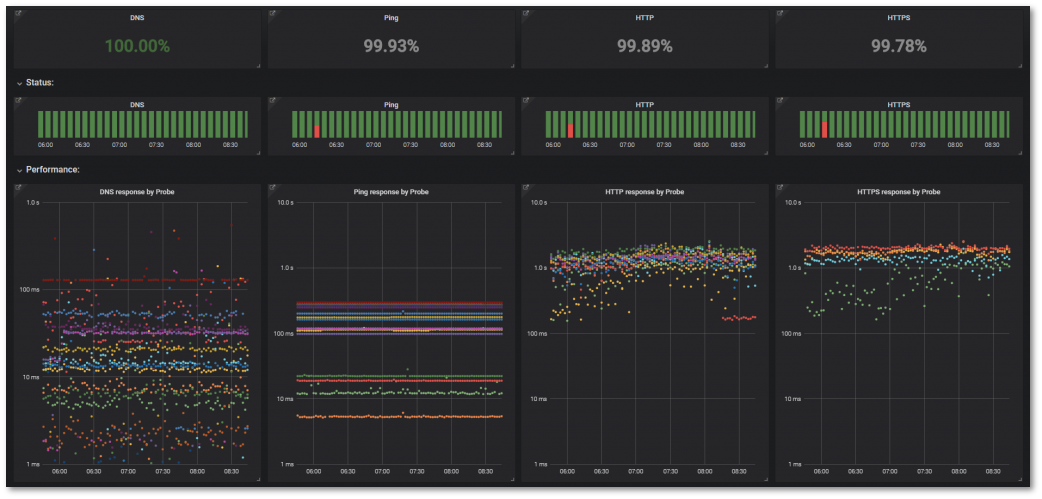
Dashboard can monitor your web page availability sending requests from around the world.
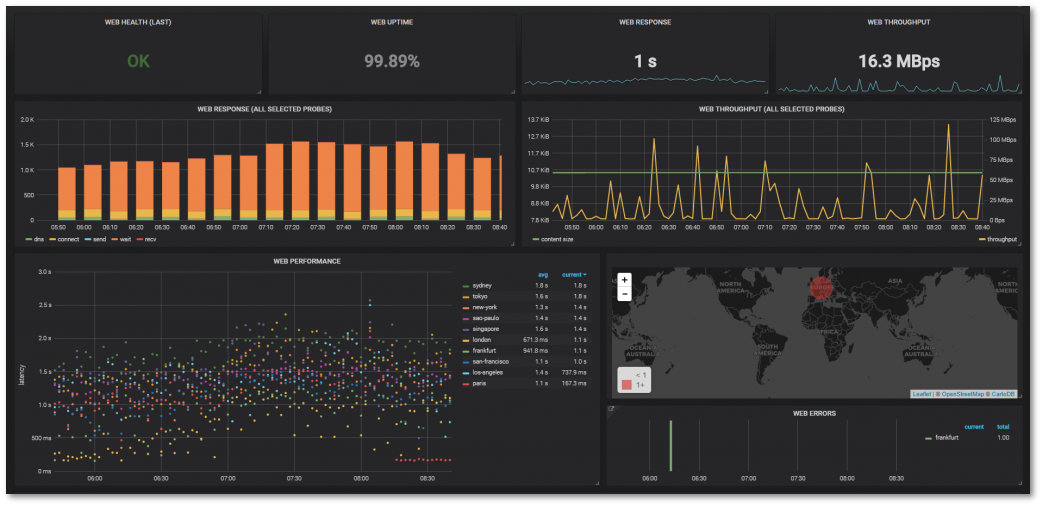
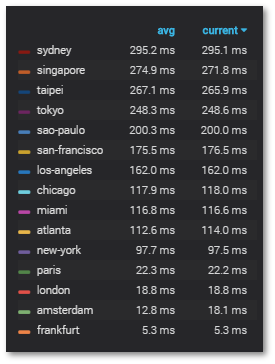
DNS, Ping, HTTP and HTTPS protocols are checked periodically:

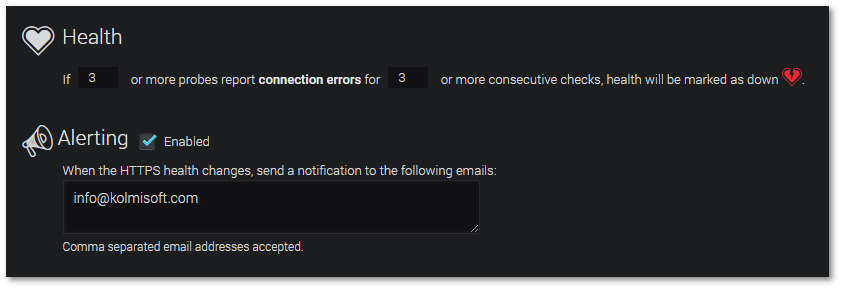
If site is down – alerts are send over email:
Various reports
Various reports are available:
Usage
Data Refreshment and Quick Ranges
To set data refreshment period and quick data ranges click on  at the right upper corner of the screen.
Here you will be able to set data refreshment period that varies from 1 second to 1 day.
Data ranges varies from last 5 minutes till last 5 years:

Modify User Interface
User interface is intuitive – it is very easy to rearrange and reorder stat panels to your liking.
- Press and hold on the right bottom corner to change size of the Chart.
- Press and hold on the Chart name to change its location.
- Press on a Chart name to Edit its title.
Hotkeys
It is possible to view dashboard in Kiosk mode by pressing d k.
Also, point the mouse on one of the graphs and press v to stretch it.
