Difference between revisions of "M4 Hangup Cause Report"
From Kolmisoft Wiki
Jump to navigationJump to search
(→Usage) |
(→Charts) |
||
| Line 16: | Line 16: | ||
= Charts = | = Charts = | ||
The pie chart shows a number of Calls by Hangup Cause Code. | *The '''pie chart''' shows a number of Calls by Hangup Cause Code. | ||
The column chart shows Answered and Failed Calls by date.<br> | *The '''column chart''' shows '''Answered''' and '''Failed''' Calls by date.<br> | ||
'''NOTE:''' Below the charts is the Cause codes table, which shows detailed information for every Hangup Cause Code. | '''NOTE:''' Below the charts is the Cause codes table, which shows detailed information for every Hangup Cause Code. | ||
<br><br> | <br><br> | ||
[[ | [[Image:M2 hgc2.png]] | ||
[[Image:M2 hgc3.png]] | |||
<br><br> | <br><br> | ||
= See also = | = See also = | ||
[[M2 Hangupcause Codes]] | [[M2 Hangupcause Codes]] | ||
Revision as of 06:56, 26 September 2018
Description
The report shows Hangup Cause Graphs by Cause Codes and Answered/Failed calls by date due to provided search options.
Usage
Go to Reports -> Hangup Cause:

You can Refine the search results by providing an intended time period, a User and their Devices and a Destination Group.
NOTE: If there is no User or Destination Group set, the search result shows Hangup Cause statistics for ALL the Users and the Destination Groups.

Charts
- The pie chart shows a number of Calls by Hangup Cause Code.
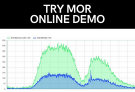
- The column chart shows Answered and Failed Calls by date.
NOTE: Below the charts is the Cause codes table, which shows detailed information for every Hangup Cause Code.